inspeXio SMX-225CT FPD HR Plus - Applications

Microfocus X-Ray CT System


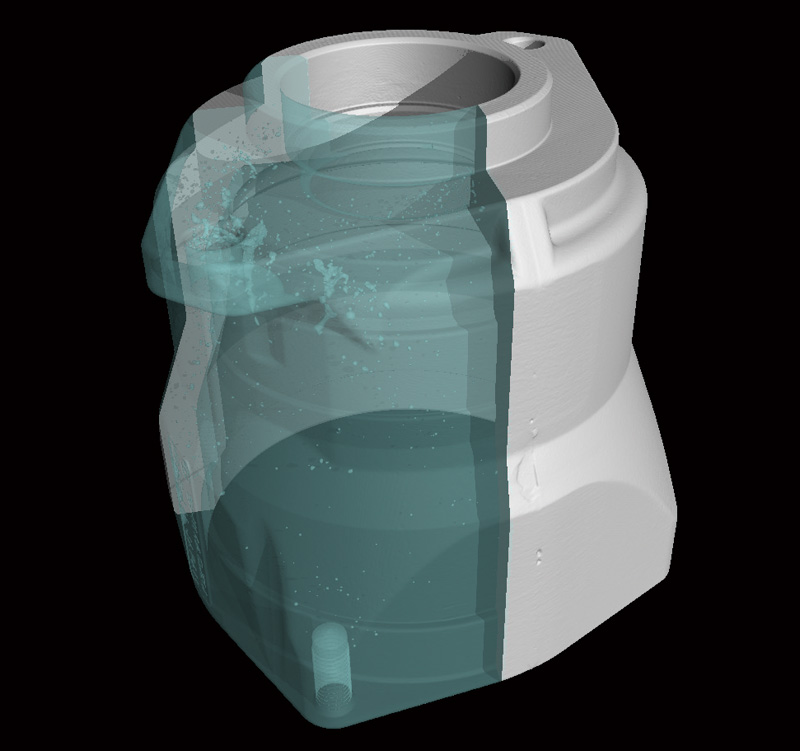
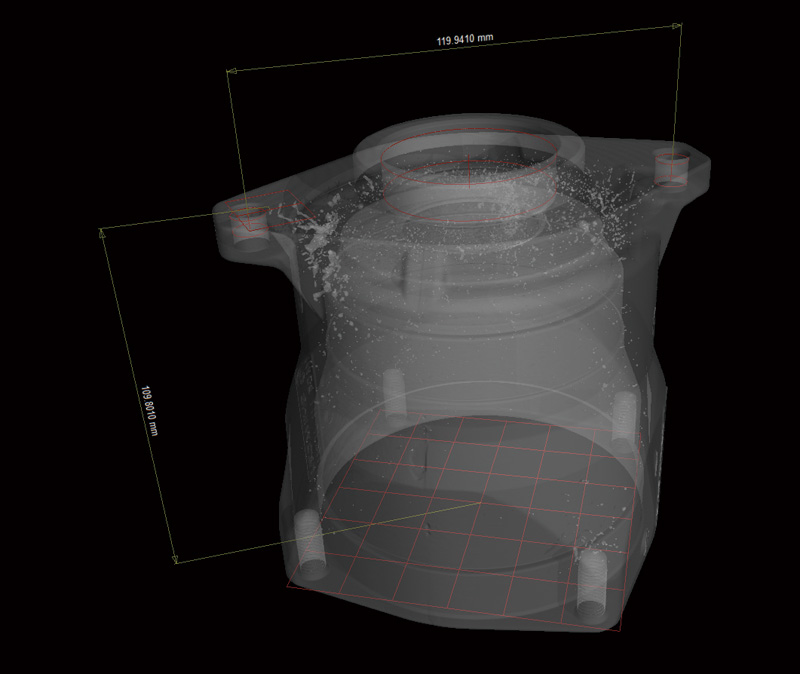
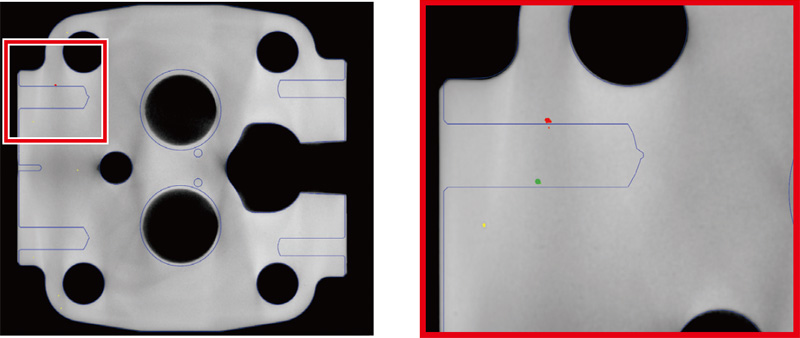
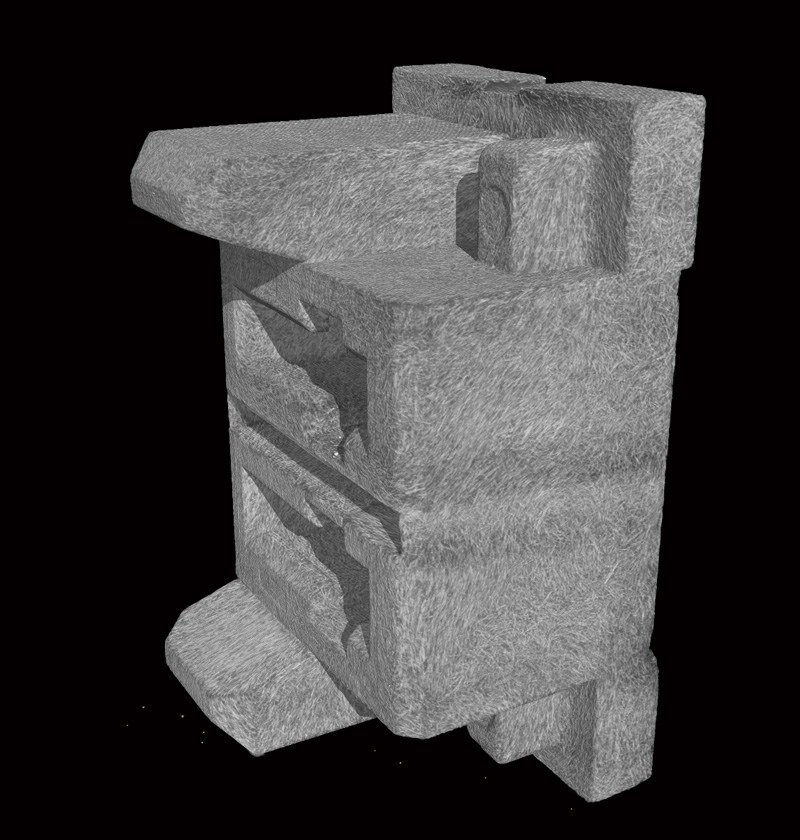
Aluminum Die Castings

sample
MPR Image
sample
VR Image
sample
3D Measurement
 
sample
Defect Analysis
sample
Defect Analysis Histogram

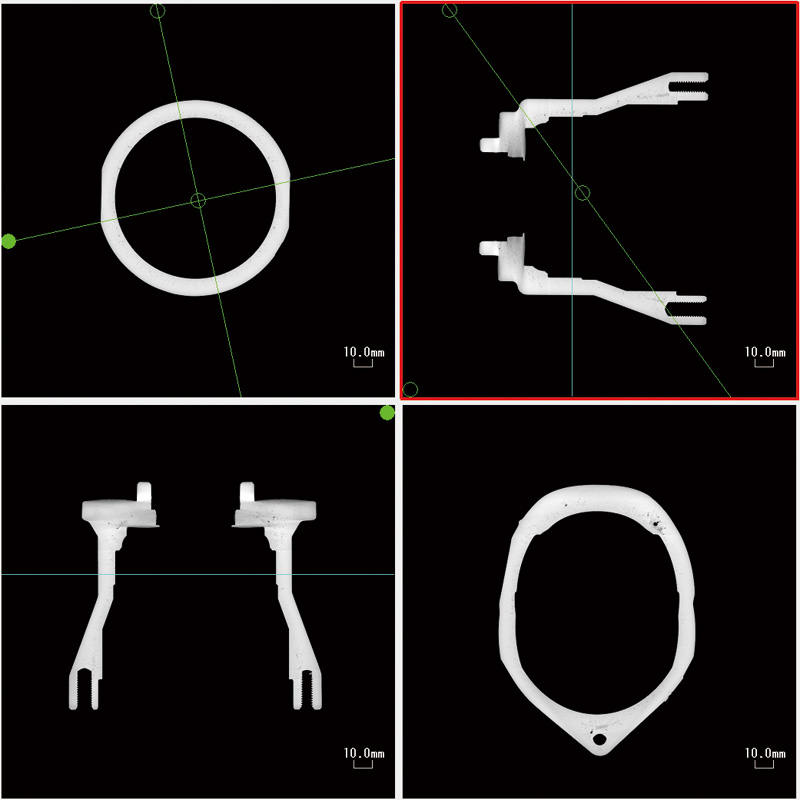
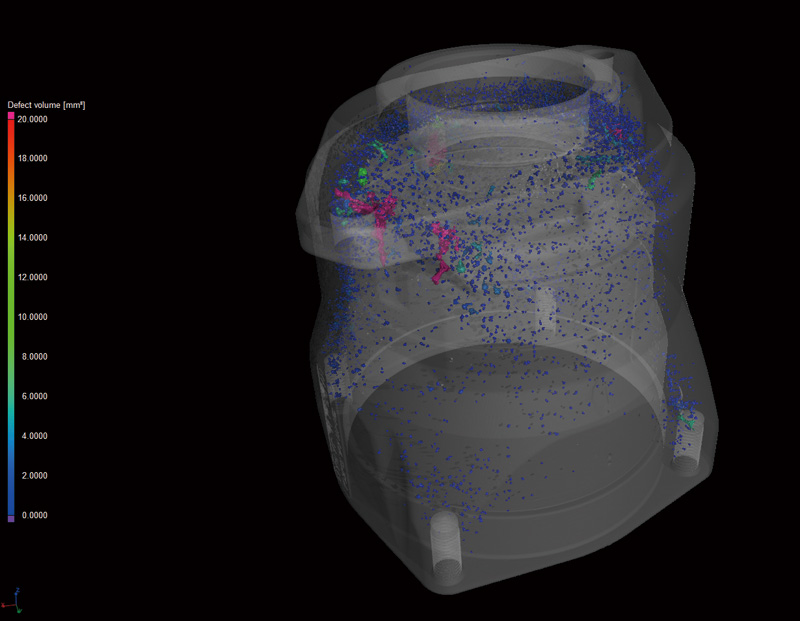
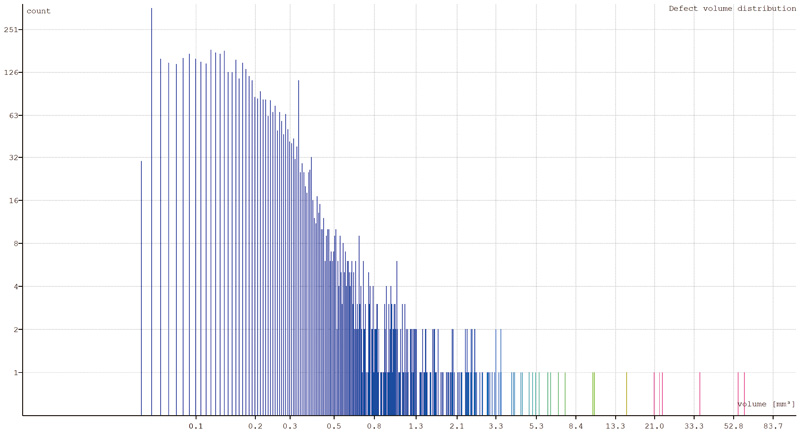
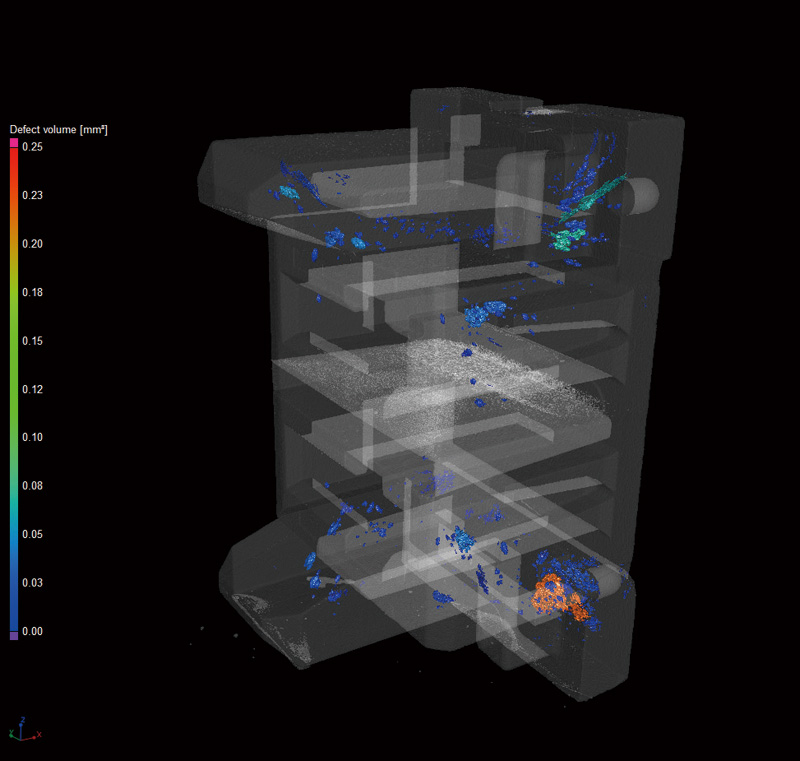
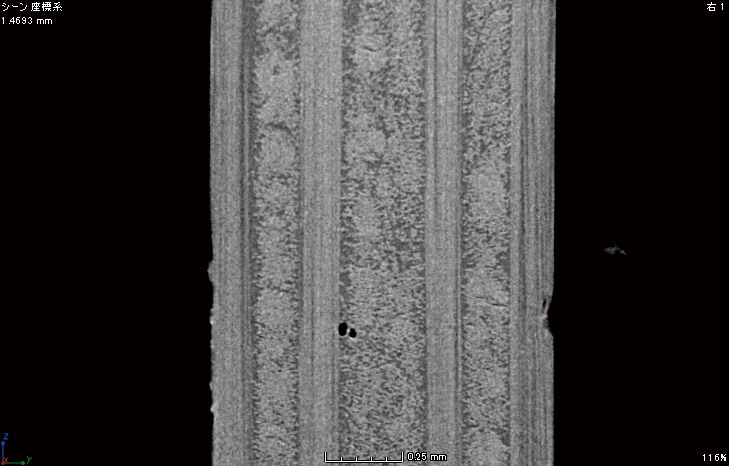
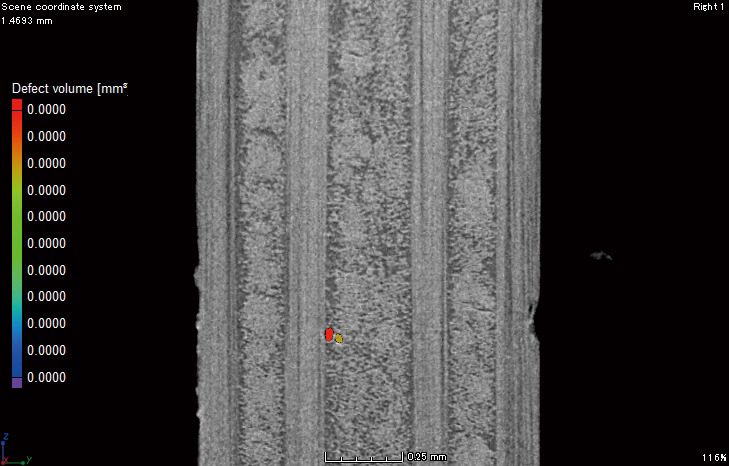
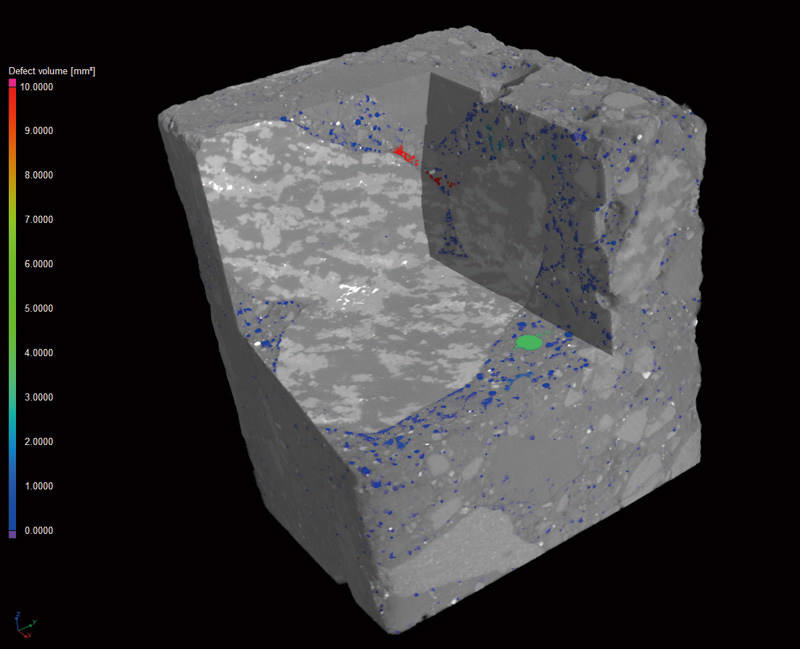
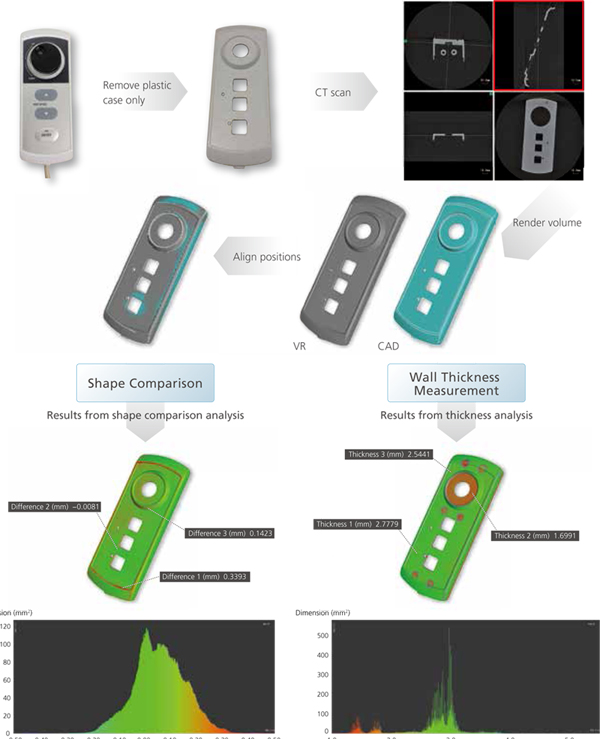
Defect analysis identifies voids and displays a color-coded map of the voids based on their volume. It can also display a frequency histogram of scale the void volume and count.
 
sample
MPR Image FOV = ø161.5 mm
sample
Defect Analysis
 

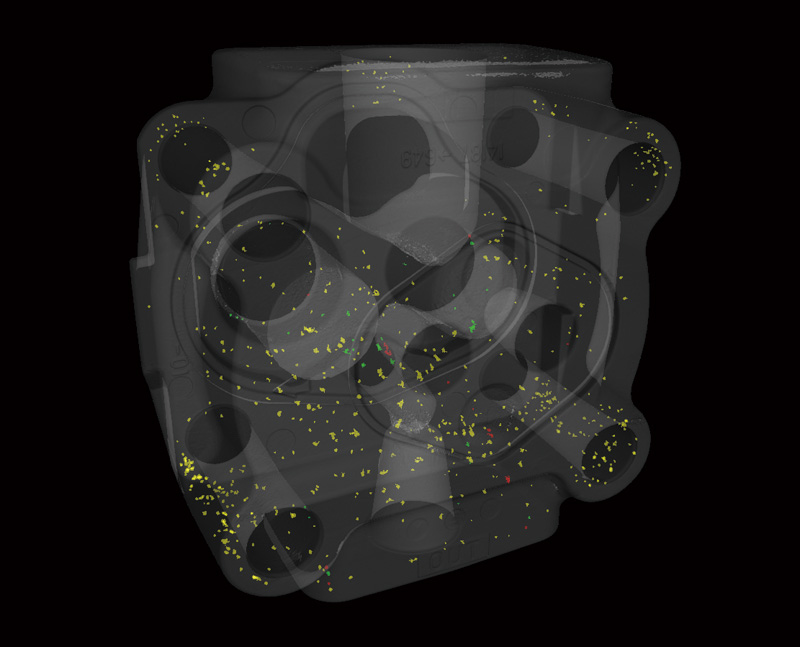
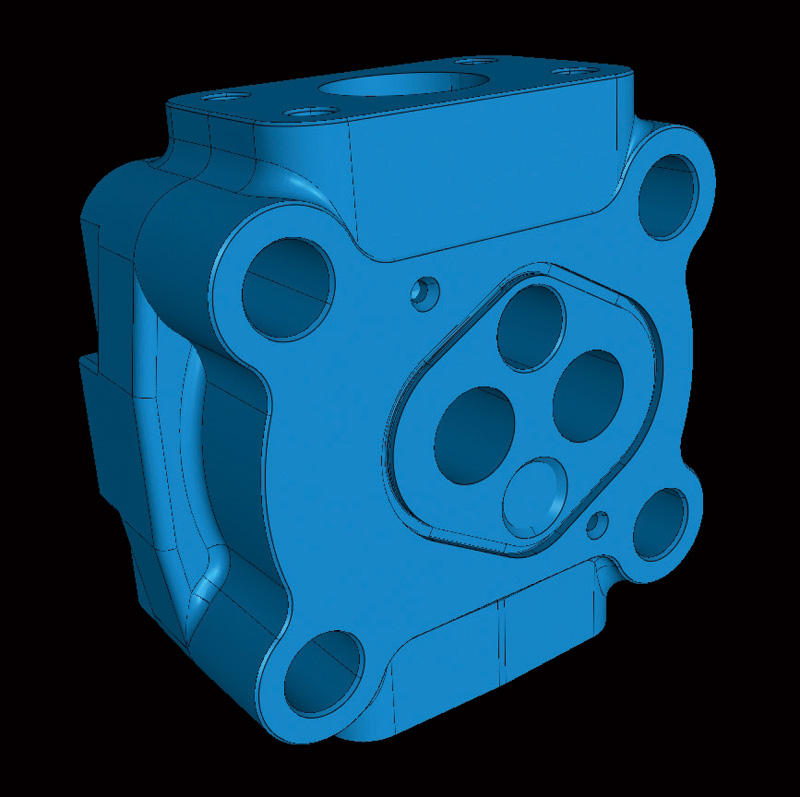
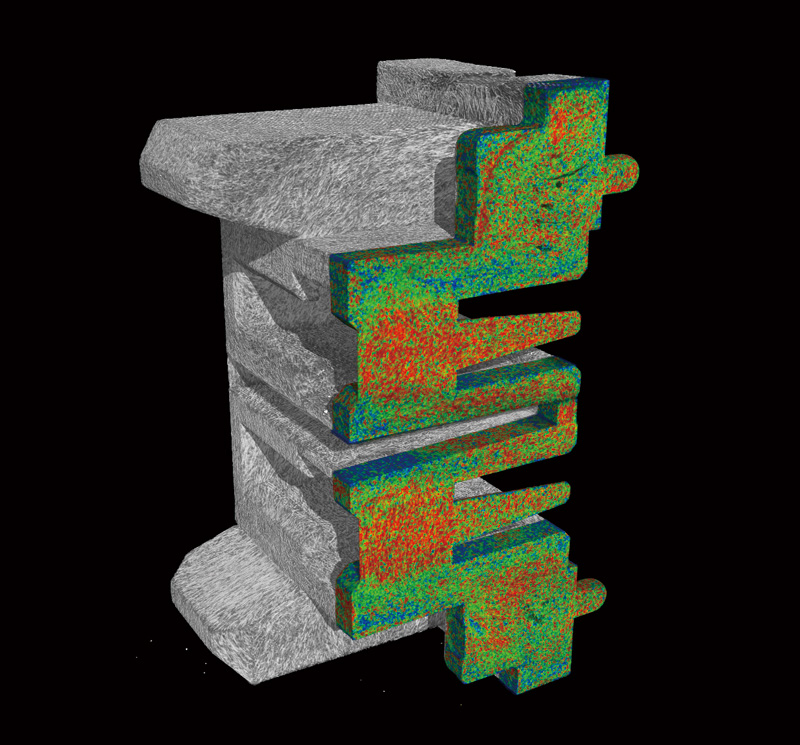
By scanning the die cast part before machining and then specifying the surface after machining (CAD data), the software can determine which voids are removed by machining, which remain internally, and which are exposed on the surface after machining.

Voids that are removed
Internal voids
Voids exposed on the surface

 
sample
3D CAD
sample
Void Determination Based on Specifying Defect Cross Section and SurfaceBlue line: CAD data analysis after machining
 

GFRP(Glass Fiber Reinforced Plastic)

sample
Cross Sectional Image FOV = ø20 mm
sample
Cross Sectional Image (enlarged view)
sample
Cross Sectional Image (enlarged view)
 
sample
VR Image
sample
Defect Analysis
sample
Defect Analysis Histogram
 
sample
sample
Fiber Orientation Analysis
sample
Fiber orientation analysis can display a color-coded map of filler orientation. Needles can also be displayed based on the orientation.
 

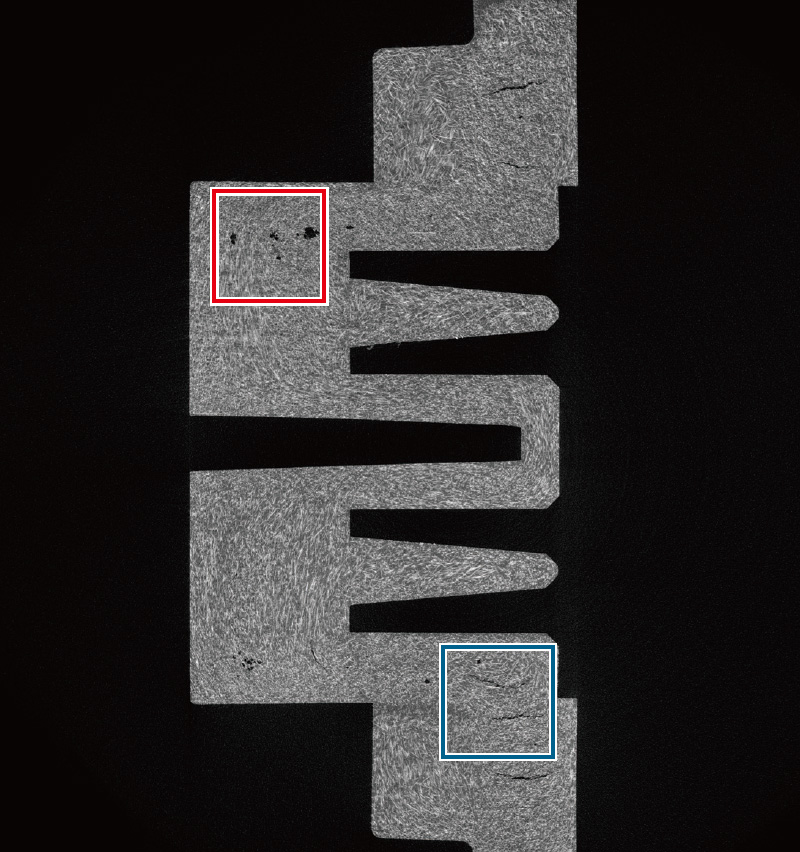
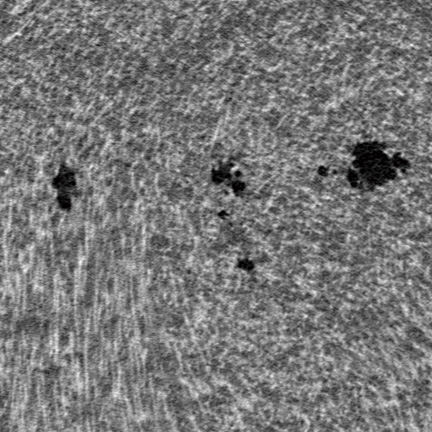
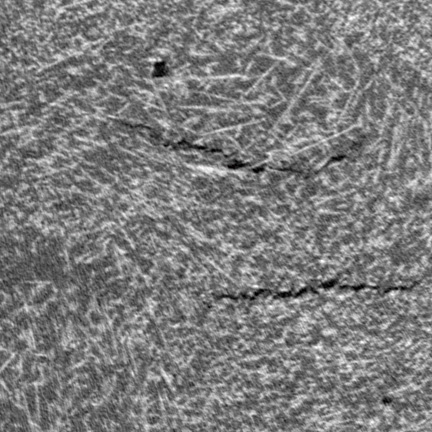
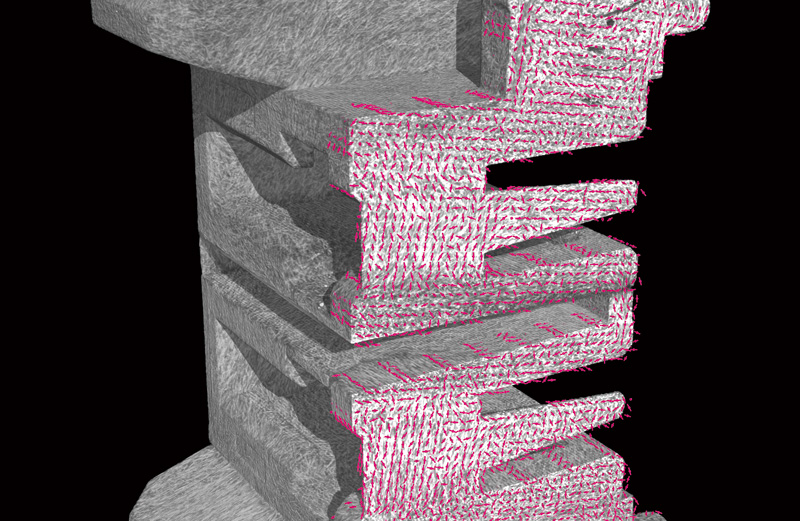
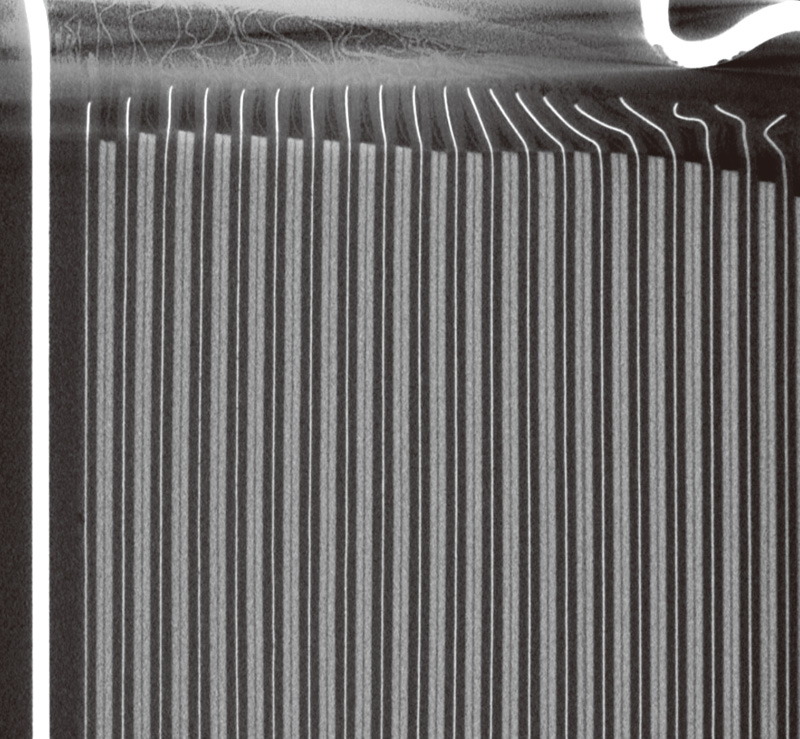
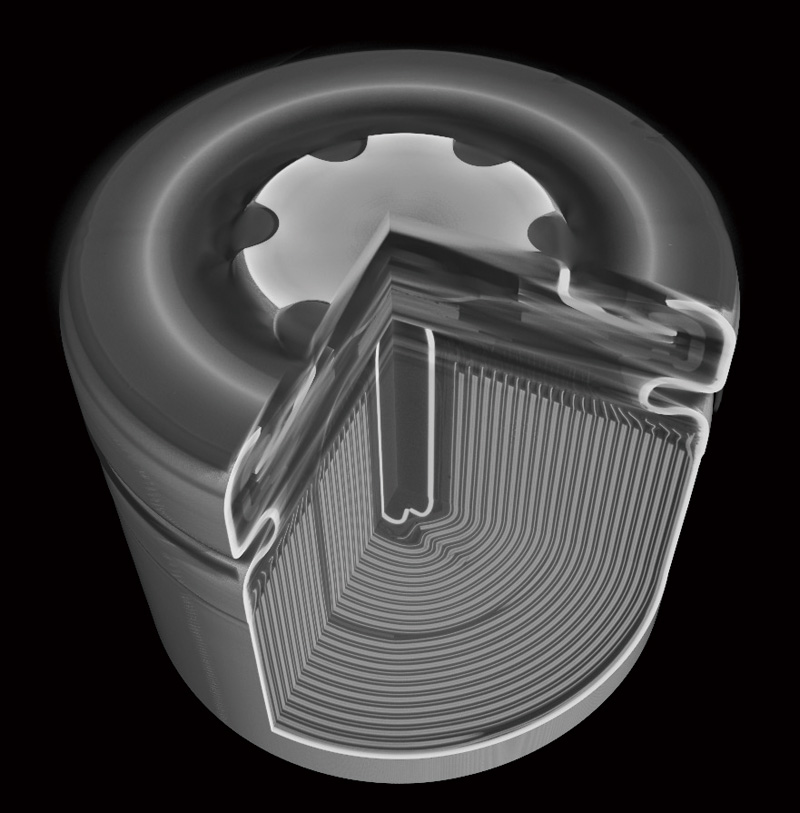
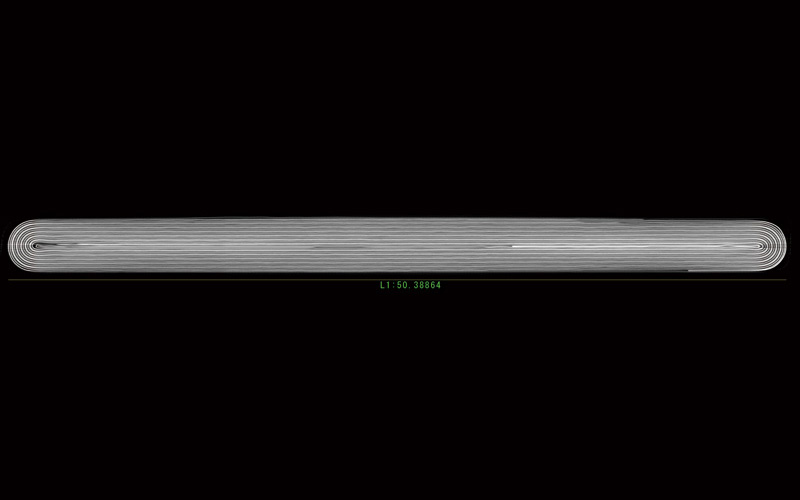
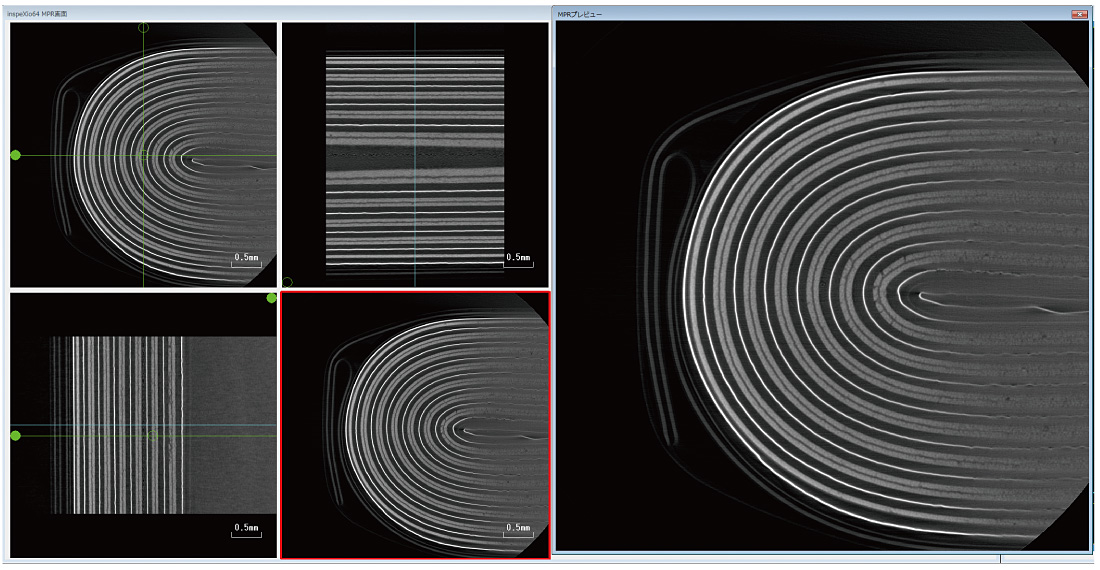
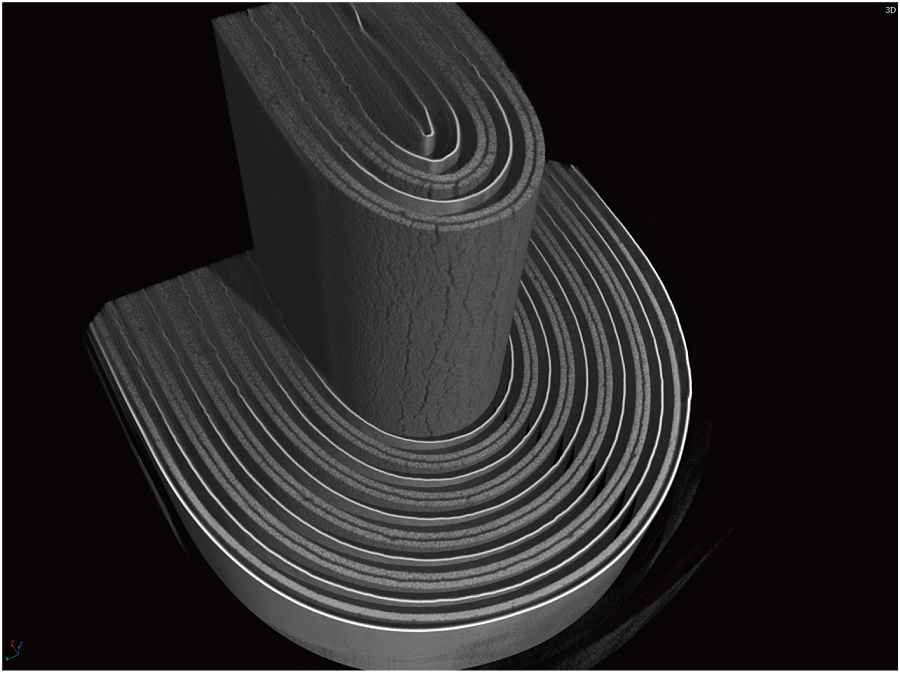
CFRTP (Continuous Fiber Reinforced Thermoplastic Laminate)

sample
MPR Image FOV = ø3.9 mm
sample
Oblique Image
sample
Defect Analysis
 
sample
VR Image
sample
Fiber Orientation Analysis

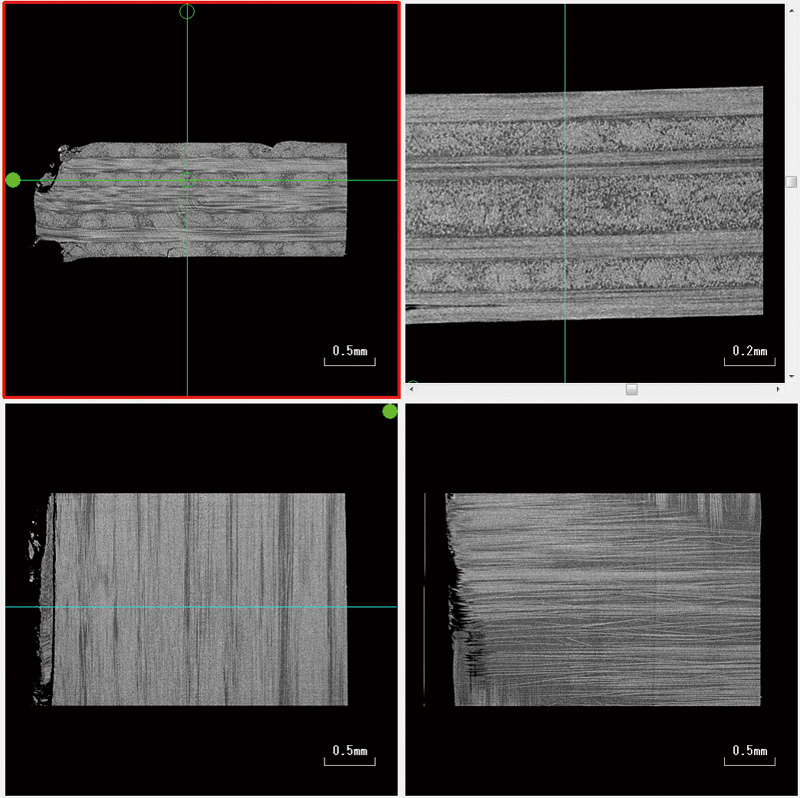
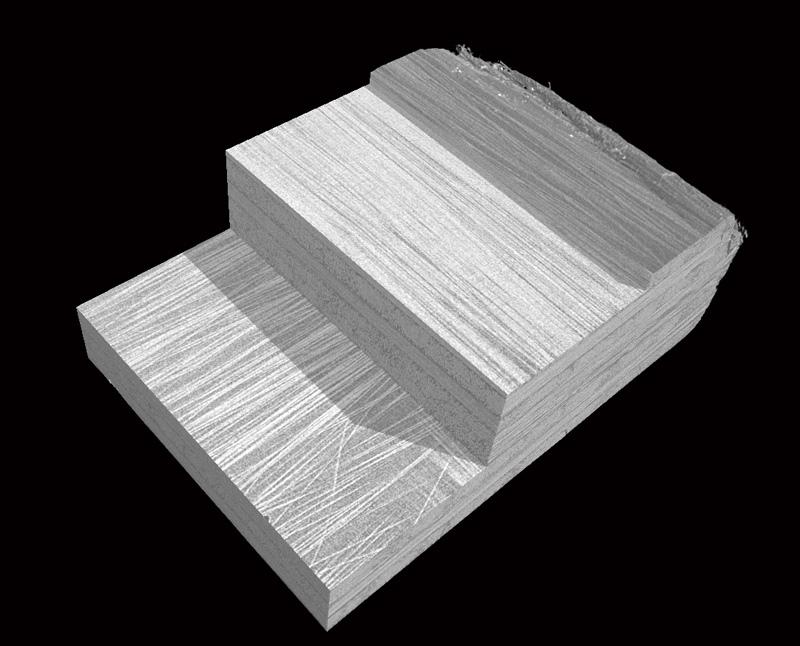
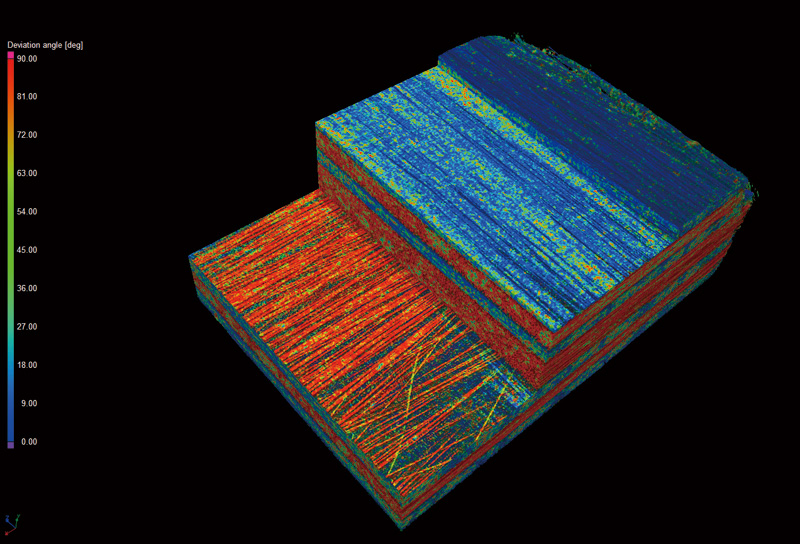
Provided by Ehime University


BGA (Ball Grid Array)

sample
MPR Image FOV = ø5 mm
sample
VR Image
 

Concrete

sample
MPR Image FOV = ø42 mm
sample
VR Image
sample
Provided by Emeritus Professor Moriyoshi at Hokkaido University
 

Lithium-Ion Rechargeable Battery

sample
Cross Sectional Image FOV = ø18.4 mm
sample
Oblique Image
sample
VR Image
 

Rectangular Lithium Polymer Battery (for Smartphones)

sample
 

Circuit Board

sample
MPR Image FOV = ø 4.4 mm
sample
VR Image
 

Mouse fetus

sample
MPR Image FOV = ø 13.7 mm
sample
VR Image

Analysis Using PointMaster Reverse Engineering Software

The software can align CT data with 3D-CAD data, calculate the distance between the boundary surface defined in the CT data and the corresponding 3D-CAD data, and display a color-coded map based on such differences.

adobe

Most of the documents on the LITERATURE is available in PDF format. You will need Adobe Acrobat Reader to open and read PDF documents. If you do not already have Acrobat Reader, you can download it free at the Adobe's Website. Click the GET ADOBE READER icon on the left to download a free copy of Adobe Acrobat Reader.