User interviews December 2020
Our field of activity is contract research and testing for life sciences industries including pharma, biotech, nutraceuticals, environmental sciences, food&agri testing, and diagnostics.
Multivariate Analysis Software That Supports MRM Data
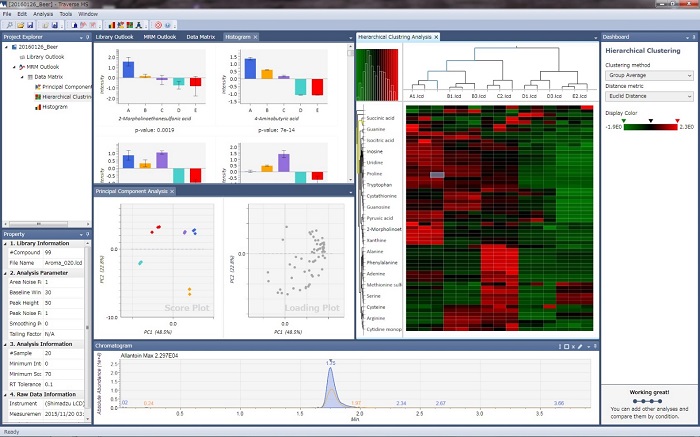
Traverse MS data analysis software is intended for high-speed processing of MRM data acquired with Shimadzu triple quadrupole LCMS systems in the field of targeted metabolomics. Using multiple samples and multiple components, the software is able to create graphical and statistically analysis for metabolic pathway analysis.
Note: The software is a product of Reifycs Inc.
The chromatograms for multiple components from a single sample or from multiple samples can be displayed side-by-side. The side-by-side feature allows for better data visualization, making the peak identification process easier. The unique characteristics of this user interface provide an efficient process of identifying peaks for multiple components.
The peak identification algorithm, which is specialized for MRM data, processes data for multiple samples and multiple components at high speeds. The algorithm assigns scores to target component peaks based on their similarity to specified reference peaks.
After identifying peaks in MRM data, the software graphs the peak area values for each component or peak area ratio values for internal standard substances. By separating the samples into groups, the mean area values and standard deviation values for target components can be graphed for comparison between multiple groups. Graphing comprehensive analytical data in this way enables users to understand analytical results more intuitively.
MRM data from multiple samples and multiple components can be analyzed using statistical analysis techniques such as principal component analysis and hierarchical cluster analysis. Analyzing massive amounts of MRM data individually can be extremely time-consuming, but statistical analysis techniques provide users with visual and easy-to-understand analytical results.
In order to understand the metabolic fluctuations in biological organisms, it is important to understand the metabolic fluctuations that occur along metabolic pathways related to target components. This software includes basic metabolic maps for glycolytic systems, pentose phosphate, and amino acid synthesis pathways, which can be loaded to display representative metabolic pathways. By linking the graphed fluctuations in each metabolite, metabolic pathway analysis is achieved.
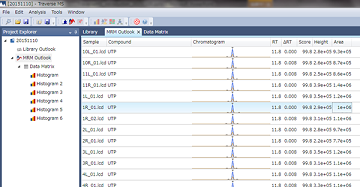
The MRM Outlook function can be used to confirm detected peaks and make necessary corrections by checking chromatograms from all samples against a reference chromatogram for each metabolite.
Conventional methods required visually checking each chromatogram from each sample one at a time, which is not efficient. However, the automatic identification algorithm specialized for MRM data and MRM Outlook function significantly reduces the work involved and increases efficiency.
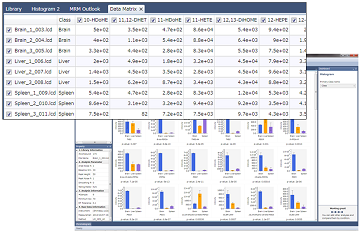
Data Matrix can categorize the data into "Classes" and normalize the data based on values. The height and area of each peak is determined from the chromatograms for each target component. Based on these values, the software displays bar graphs of the average and standard deviation of height or area values for the classes. These histograms allow for the users to view the data easily.
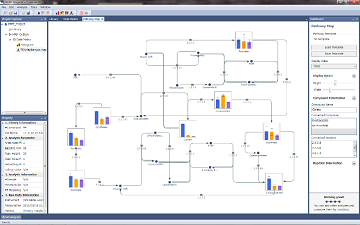
The software displays representative metabolic pathways by loading a template metabolic map file or creating a new metabolic map file.
Compound graphs created from a data matrix can be linked to create metabolic pathways, so that users can understand compound metabolite fluctuations of interest in more detail.
Remarks and Precautions
User interviews December 2020
Our field of activity is contract research and testing for life sciences industries including pharma, biotech, nutraceuticals, environmental sciences, food&agri testing, and diagnostics.
LCMS Food Safety Application is now available.
Application Note: "Analysis of Pharmaceuticals' Impurity - Regulations and Analysis for Carcinogenic Substances -"
Application Note: "Various Analysis Techniques for Organic Acids and Examples of Their Application"
Shimadzu has released the Metabolites Method Package Suite.
Provides ready-to-use methods for over 1900 metabolites
This suite allows comprehensive analysis of over 1900 metabolites without the need for investigation of separation conditions, MRM optimization or parameter settings.
Direct Probe Ionization Mass Spectrometer - APPLICATION NOTEBOOK -